
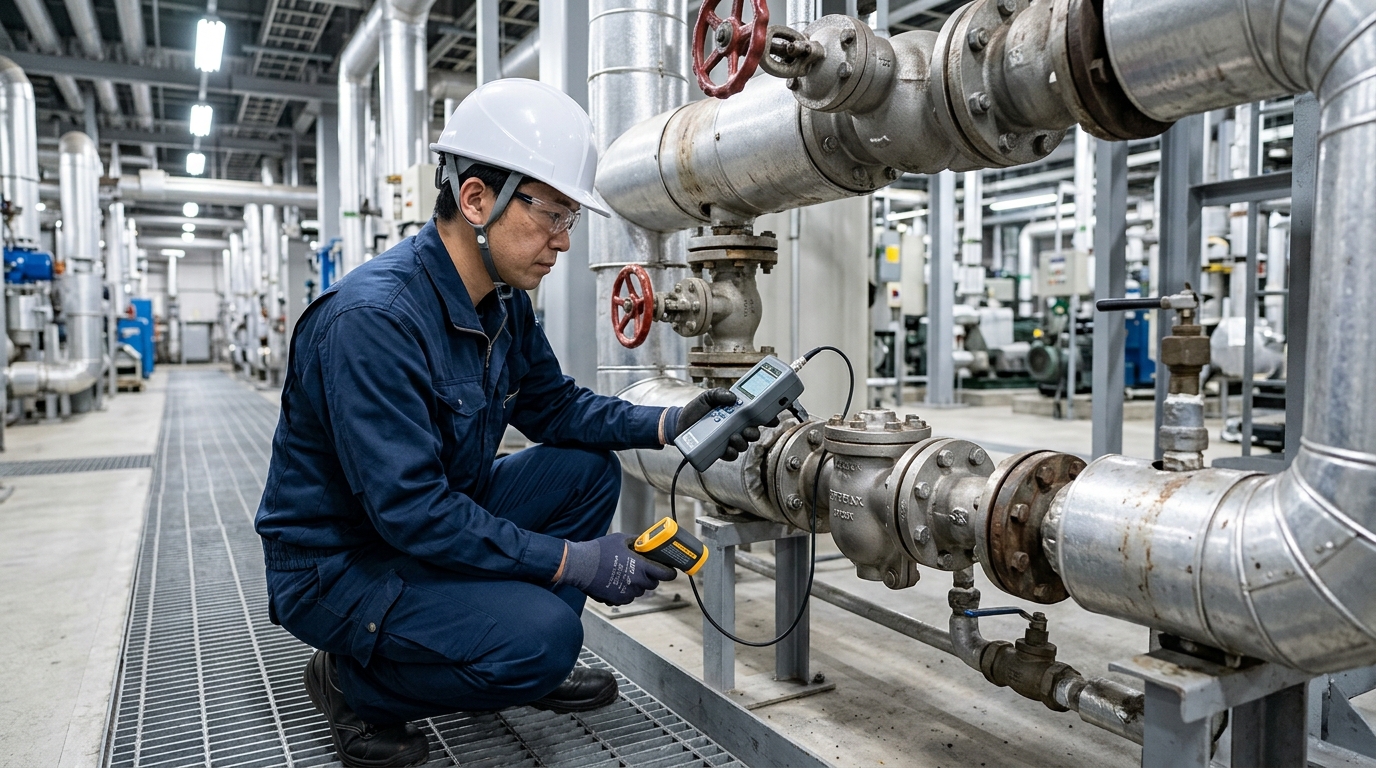
When a steam trap fails into a “blow-through” (blowing) condition, it continuously discharges not only condensate but also live steam itself, and this loss is added to your fuel costs while remaining invisible. The value of diagnosis lies in identifying this hard-to-notice steam leakage on a per-failed-trap basis, so you can prioritize and address it. Many leaks are difficult to distinguish from visual inspection or operating data alone, and if left unaddressed, the losses accumulate. Understanding which traps are in which condition is the starting point for reducing steam loss.
Key points of this article
- Blow-through in a failed trap translates directly into fuel costs as steam loss, but it is hard to detect from external appearance.
- Diagnosis helps identify defective traps and set priorities for addressing them. However, the achievable defect rate and energy-saving effect vary greatly depending on facility conditions.
- The more traps a plant has, the greater both the losses from leaving them unaddressed and the room for improvement from addressing them tend to be.
How a steam trap failure creates “invisible steam loss”
A steam trap is an automatic valve that blocks steam and discharges only condensate (drain). When this valve stays open and can no longer close due to wear, foreign matter jamming, or similar causes, steam keeps escaping along with the condensate. This is blow-through, and when the discharge side is outdoors or a recovery tank, it blends into the noise or vapor and is hard to notice, so the loss continues as long as the trap is in operation.
Failures occur in both “fail-open” and “fail-closed” modes
Trap failures broadly fall into two directions: stuck open (blow-through) and stuck closed (poor discharge). Blow-through translates into fuel costs as steam loss, while a fail-closed condition leads to quality and equipment risks such as heating failure or water hammer caused by retained condensate. Both are difficult to judge from appearance alone, so the condition is estimated by combining factors such as operating sound, surface temperature, and discharge status.
The more traps there are, the more losses accumulate
The steam loss per trap ranges in estimated examples from a few kg/h to several tens of kg/h, depending on bore diameter, pressure, and the degree of failure (all are rough guides that depend on conditions). In a plant with several hundred traps, if a certain proportion of them are simply blowing through, the annual difference in fuel costs and CO2 emissions becomes non-negligible. That is exactly why it is important to quantify “how many traps there are, and how many of them are defective.”
What diagnosis reveals, and how to read case studies correctly
In the case of a certain chemical products manufacturing plant (with roughly 300 traps), diagnosis revealed a defect rate of about 40%—meaning around 100 traps were in a blow-through or poor-discharge condition. As replacement and servicing proceeded starting with the highest-priority items, the defect rate fell to around 10 to 13%, and the steam loss for the addressed traps was reduced. When converting the energy-saving effect into a monetary figure, the order of thinking is: multiply the reduced steam volume by the manufacturing cost per ton of steam (the total of fuel, water, and so on—as a rough guide, on the order of several thousand yen per ton), and from there estimate the fuel reduction, CO2 reduction, and payback period. In this plant, because the number of traps addressed was large, the recovery relative to the diagnosis and replacement costs fell within a relatively short period.
These figures cannot be generalized as-is
The 40% → 10–13% result is nothing more than the outcome for a single plant. Performing a diagnosis does not necessarily lower the rate to this level. The achievable defect rate, and the steam volume and monetary amount that can be reduced, vary greatly depending on the type of trap (disc type, float type, bimetal type, etc.), the bore diameter and pressure, the operating conditions, and the maintenance history to date. At sites with few traps, fluctuations expressed as percentages appear large, while at sites with many traps, the same percentage produces a larger absolute loss amount. The appropriate way to read the case study is as a process in which “diagnosis allowed the actual state of defects to be grasped quantitatively, so they could be prioritized and addressed.”
Frequently asked questions
Q1. Can blow-through be identified by appearance?
A1. In layouts where the discharge point is hard to see, it is often difficult to judge. It is common to estimate the condition by combining factors such as operating sound, surface temperature, and discharge status.
Q2. Will diagnosis always lower the defect rate to the 10% range?
A2. No. The case study is the result for a single plant, and the level reached varies with facility conditions, the type of trap, and operating conditions. Treat the figures as rough guides.
Q3. How should the energy-saving effect be estimated?
A3. Multiply the reduced steam volume by the unit price of steam to convert it into a monetary figure, and from there estimate the fuel and CO2 reductions and the payback period. Results change depending on the assumptions.
Q4. Is there no point unless all traps are replaced at once?
A4. Not necessarily. It is also common to address traps with the greatest losses or quality risks first and proceed in stages.
Q5. How often should traps be checked?
A5. It varies with operating conditions, but regularly checking the condition helps detect blow-through early. Set the frequency according to the equipment and its importance.
Q6. Can it be handled by servicing rather than replacement?
A6. It depends on the failure mode and the model. The realistic approach is to check the condition of wear, foreign matter, and so on, and then decide between replacement and servicing.
Summary
Steam trap failures, blow-through in particular, remain hard to notice from external appearance while they accumulate as steam loss in your fuel costs. The value of diagnosis lies in grasping defective traps quantitatively and addressing those with the greatest losses or risks first. The improvement rate in the case study cannot be generalized as-is, but the more traps a plant has, the greater the effect of grasping and addressing them tends to be.
If you face challenges with your own steam system—such as “we cannot tell normal traps from defective ones,” “we do not know how to convert the steam loss from blow-through into a monetary figure,” or “we cannot decide which model or bore diameter to replace with”—please make use of Yoshitake’s technical and selection consultations. After organizing your operating conditions and trap types, we will guide you through grasping the condition and selecting suitable models.